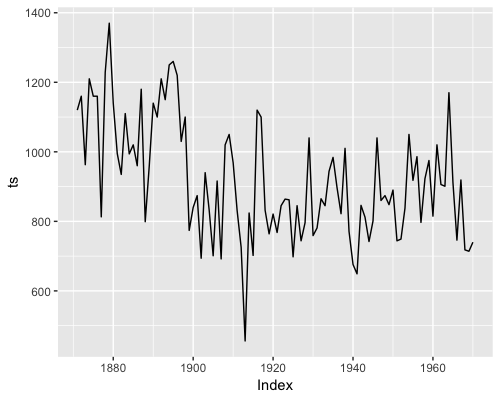
例えば次のような時系列データがあるとします。
library(xts)
ts <- as.xts(Nile)

library(ggplot2)
autoplot(ts)

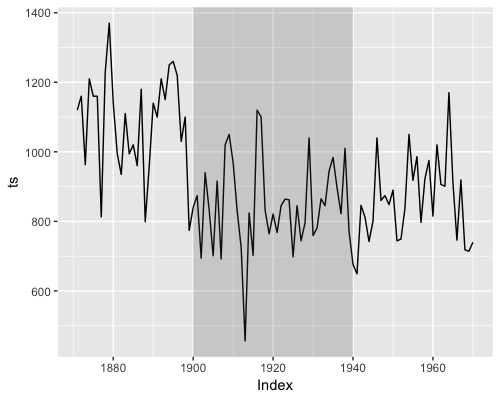
このプロットの 1900年から1940年までの区間に影をつけたい。
これには annotate() が便利ぽい。
autoplot(ts) +
  annotate("rect",
           xmin = as.Date("1900-01-01"),
           xmax = as.Date("1940-01-01"),
           ymin = -Inf, ymax = Inf, alpha = 0.2)

Enjoy!